| Title: | Variable Selection Using Shrinkage Priors |
| Version: | 1.1.0 |
| Description: | Select variables from shrinkage-prior posterior coefficient draws using sequential two-means clustering from Li and Pati (2017) <doi:10.1016/j.csda.2016.10.008>. Estimate a signal count at each tuning threshold and rank coefficients by posterior median absolute magnitude. Accept supplied coefficient draws or fit Gaussian shrinkage regression through 'bayesreg' or native ridge, horseshoe and spike-and-slab samplers. Retain chain identities for diagnostics, prediction and posterior plots. Also provide the signal adaptive variable selector of Ray and Bhattacharya (2018) <doi:10.48550/arXiv.1810.09004>, decoupled shrinkage and selection with the adaptive-L1 approximation of Hahn and Carvalho (2015) <doi:10.1080/01621459.2014.993077>, optional exact two-cluster fitting, basic two-means selection, exact-zero spike-and-slab inclusion summaries and tuning sensitivity summaries. |
| License: | GPL (≥ 3) |
| Encoding: | UTF-8 |
| RoxygenNote: | 7.3.3 |
| Imports: | bayesreg, graphics, stats, utils |
| Suggests: | posterior (≥ 1.6.0), covr, MASS, knitr, rmarkdown, tinytex, testthat (≥ 3.2.0) |
| Config/testthat/edition: | 3 |
| Maintainer: | Nilson Chapagain <nilson.chapagain@gmail.com> |
| URL: | https://github.com/nilson01/VsusP-variable-selection-using-shrinkage-priors |
| BugReports: | https://github.com/nilson01/VsusP-variable-selection-using-shrinkage-priors/issues |
| VignetteBuilder: | knitr |
| NeedsCompilation: | no |
| Packaged: | 2026-10-28 15:34:37 UTC; nilson |
| Author: | Nilson Chapagain  [aut, cre],
Debdeep Pati [aut] |
| Repository: | CRAN |
| Date/Publication: | 2026-10-28 17:00:02 UTC |
Variable selection from Bayesian shrinkage priors
Description
Select variables from posterior coefficient draws, or fit Gaussian shrinkage regression and summarize its posterior. Selection and posterior fitting are separate operations.
Gaussian regression
FitRidge(), FitHorseshoe() and FitSpikeSlab() retain separate iteration,
chain and predictor axes. PosteriorDraws() pools chains for selection.
Use summary and predict for posterior estimates and pointwise intervals.
ChainDiagnostics(), PlotTrace() and PlotAutocorrelation() keep chain
identities. Successful sampling alone does not establish convergence.
Selection
Sequential2MeansBeta() and TwoMeansBeta() summarize supplied draws;
S2MSensitivity() compares thresholds. SpikeSlabSelection() counts exact
nonzero coefficients. SAVS() and DSS() construct sparse coefficient
summaries and can return no selected variables. Clustering counts are not
inclusion probabilities or false-discovery guarantees.
Fixed-posterior checks
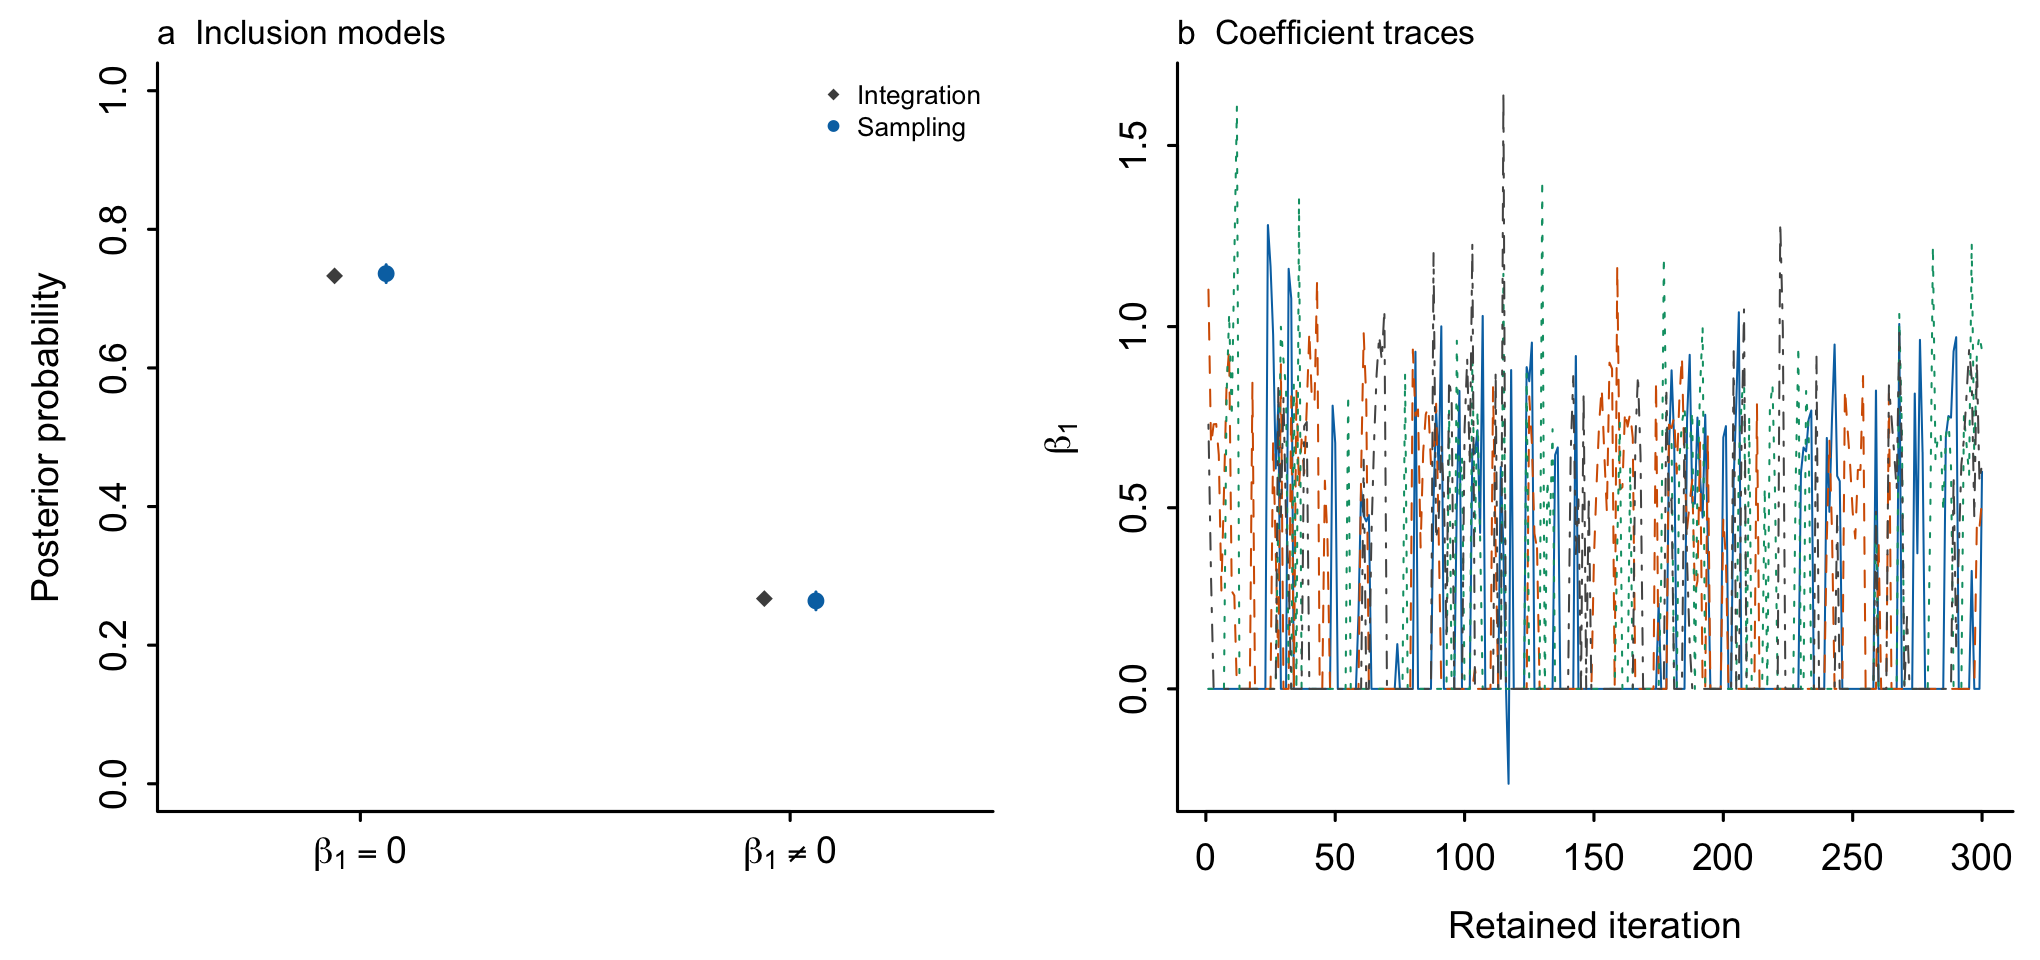
The following plots use five observations and one predictor. Four chains
retain 3000 iterations each after 1000 burn-in iterations. HS denotes
horseshoe and SS denotes spike-and-slab. Sampled posterior summaries are
compared with independent numerical integration. The audit tolerance is
the larger of 0.01 and six estimated Monte Carlo standard errors, computed
using 100-draw batches. The shaded range is an audit criterion, not a
confidence interval. These checks do not establish performance across
repeated datasets.

The spike-and-slab model has two possible inclusion states. Points compare
their integrated and sampled probabilities; error bars are plus or minus
1.96 estimated Monte Carlo standard errors. Traces display the first 300
retained coefficient draws per chain. All retained draws enter the summaries.
Author(s)
Maintainer: Nilson Chapagain nilson.chapagain@gmail.com (ORCID)
Authors:
Debdeep Pati debdeep@tamu.edu
References
Li, H. and Pati, D. (2017). Variable selection using shrinkage priors. Computational Statistics & Data Analysis, 107, 107–119. doi:10.1016/j.csda.2016.10.008.
See Also
FitGaussian(), PlotCoefficients(), PlotInclusion(),
vignette("VsusPVignette")
Calculate diagnostics with explicit chain identities
Description
Delegate rank R-hat, bulk/tail effective sample size and mean Monte Carlo standard error to the optional posterior package.
Usage
ChainDiagnostics(draws, feature.names = NULL)
Arguments
draws |
A native fit, or finite numeric array with iteration, chain, variable axes. A pooled matrix is not accepted. |
feature.names |
Unique variable names for an array. A fit supplies its own names and includes intercept and residual-variance diagnostics. |
Details
At least four retained iterations per chain are required. Install posterior separately when using this function. No chain is reconstructed from a pooled draw matrix. R and Python diagnostics can differ slightly between backend versions; both use the cited rank-based definitions.
Value
Data frame with rhat, ess.bulk, ess.tail, mcse.mean and status. A single chain has unavailable R-hat. Constant variables have unavailable diagnostics. Finite diagnostic values do not certify convergence.
References
Vehtari et al. (2021). Rank-normalization, folding, and localization: An improved R-hat for assessing convergence of MCMC. doi:10.1214/20-BA1221.
Examples
if (requireNamespace("posterior",quietly=TRUE)) {
  a <- array(sin(seq_len(800)),c(100,2,4))
  ChainDiagnostics(a)
}
Sparse prediction with the DSS adaptive-lasso approximation
Description
Approximate the posterior-mean linear predictor with a sparse coefficient vector using the decoupled shrinkage and selection (DSS) adaptive-L1 criterion of Hahn and Carvalho (2015), equation (21).
Usage
DSS(X, beta, lambda, tol = 1e-08, max.iter = 10000L)
Arguments
X |
Finite numeric design matrix with observations in rows and coefficients in columns. Exclude the intercept and zero-norm columns. |
beta |
Finite numeric coefficient vector in the same column order as X. Supplied names must be unique and nonempty. If both beta and X have names, their order must agree. |
lambda |
Nonnegative scalar penalty. It must be chosen by the caller; larger values penalize nonzero coefficients more strongly. |
tol |
Relative tolerance for the convex optimality (KKT) conditions, strictly between zero and one. Default 1e-8. |
max.iter |
Maximum number of coordinate-descent sweeps. Default 10000. |
Details
Here beta represents the posterior mean, and X contains the prediction points at which the sparse predictor should approximate X beta. These need not be the observations used to fit the posterior. The objective is
n^{-1}\|X\bar{\beta}-X\gamma\|_2^2 +
    \lambda\sum_{j:\bar{\beta}_j\ne0}|\gamma_j|/|\bar{\beta}_j|.
This is the paper's adaptive-L1 approximation, not exact minimization of its L0 counting penalty.
For positive lambda, a zero beta entry constrains the corresponding sparse coefficient to zero, the infinite-weight limit. For lambda = 0, beta itself is returned as a least-squares minimizer. No intercept, centering or scaling is added. Exclude the intercept and keep its contribution separately. The adaptive criterion is unchanged by rescaling predictor columns and inversely rescaling beta, apart from floating-point error and nonunique solutions. Changing response units requires changing lambda accordingly.
Cyclic coordinate descent solves the convex surrogate in the transformed design X times abs(beta). The KKT error is divided by the larger of lambda and the largest absolute initial gradient. A result is converged when this ratio is at most tol. The iteration limit produces a warning and converged = FALSE; inspect this flag before using the selection. Overflow and detected underflow in transformed columns, norms, sparse coefficients or squared errors are rejected. With dependent predictor columns, coefficients and selected sets need not be unique; coordinates are visited in the supplied column order.
Squared error here measures approximation to the supplied posterior mean at X, not held-out predictive error. The function does not select lambda, compute inclusion probabilities or establish false-discovery control.
Value
A vsusp_sparse list with coefficients, selected (integer column indices, possibly integer(0)), p, lambda, fitted (X coefficients), mse (mean squared approximation error), penalty (weighted L1 penalty including lambda), objective (mse + penalty), iterations, kkt.error (relative KKT error) and converged. Numerical diagnostics concern the convex surrogate only.
References
Hahn, P. R. and Carvalho, C. M. (2015). Decoupling Shrinkage and Selection in Bayesian Linear Models: A Posterior Summary Perspective. Journal of the American Statistical Association, 110(509), 435-448. doi:10.1080/01621459.2014.993077.
Examples
X <- diag(2)
DSS(X, c(2, .1), lambda = .2)$coefficients
DSS(X, c(2, .1), lambda = 10)$selected
Fit native Gaussian shrinkage regression
Description
Fit ridge, horseshoe or exact-zero spike-and-slab regression while retaining separate iteration and chain axes. Existing bayesreg wrappers are unchanged.
Usage
FitGaussian(
  X,
  y,
  prior = c("ridge", "horseshoe", "spike-slab"),
  draws = 1000L,
  burnin = NULL,
  chains = 4L,
  seed = NULL,
  prior.scale = 1,
  feature.names = colnames(X)
)

FitRidge(
  X,
  y,
  draws = 1000L,
  chains = 4L,
  prior.scale = 1,
  seed = NULL,
  feature.names = colnames(X)
)

FitHorseshoe(
  X,
  y,
  draws = 1000L,
  burnin = 1000L,
  chains = 4L,
  seed = NULL,
  feature.names = colnames(X)
)

FitSpikeSlab(
  X,
  y,
  draws = 1000L,
  burnin = 1000L,
  chains = 4L,
  seed = NULL,
  feature.names = colnames(X)
)
Arguments
X |
Finite numeric predictor matrix, without an intercept column. At least two rows are required. Constant columns are not supported. |
y |
Finite numeric response vector with one entry per row of X. |
prior |
One of "ridge", "horseshoe" or "spike-slab". |
draws |
Positive integer retained iterations per chain. |
burnin |
Nonnegative integer discarded iterations per chain, additional to draws. Defaults to zero for ridge and 1000 for the sampled priors. |
chains |
Positive integer number of separately seeded chains. |
seed |
Nonnegative integer seed, or NULL to use the current R RNG. A supplied seed leaves the caller's RNG state unchanged. |
prior.scale |
Positive ridge prior standard-deviation multiplier. Other priors require its default value of one. |
feature.names |
Unique nonempty predictor names. Defaults to column names, or x1, x2, and so on. |
Details
The likelihood is Gaussian with a flat intercept prior. Predictors and response are centered, not standardized. The intercept is integrated during coefficient/variance updates and then sampled on the original scale. The residual-variance prior is IG(1.5,1.5), with density proportional to x^(-a-1) exp(-b/x). Ridge coefficients have conditional variance sigma2 * prior.scale^2. Horseshoe local and global scales independently follow half-Cauchy(0,1) priors. For spike-and-slab, inclusion probability follows Beta(1,15), slab variance multipliers follow IG(1.5,1.5), and excluded coefficients are exactly zero. R and Python use different random-number streams. Retained draws do not prove convergence.
Value
A vsusp_fit list with beta (iteration by chain by predictor), intercept and sigma2 (iteration by chain), prior, feature.names, extra scale/inclusion draws and metadata. Draws count retained iterations.
References
Li, H. and Pati, D. (2017). Variable selection using shrinkage priors. Computational Statistics & Data Analysis, 107, 107–119. doi:10.1016/j.csda.2016.10.008.
Makalic, E. and Schmidt, D. F. (2016). A simple sampler for the horseshoe estimator. doi:10.1109/LSP.2015.2503725.
Bhattacharya, A., Chakraborty, A. and Mallick, B. K. (2016). Fast sampling with Gaussian scale-mixture priors in high-dimensional regression. doi:10.1093/biomet/asw042.
See Also
PosteriorDraws(), ChainDiagnostics()
Examples
X <- cbind(x1 = c(-2,-1,0,1,2,0), x2 = c(0,1,-1,0,1,-1))
fit <- FitRidge(X, c(-4,-2,0,2,4,0), draws=100, chains=2, seed=8)
summary(fit)
predict(fit, X[1:2,,drop=FALSE])
Plot the sequential two-means tuning path
Description
Display the estimated signal count at each threshold to support a choice of tuning parameter. The function does not choose a threshold or H.
Usage
OptimalHbi(bi, Hbi)
Arguments
bi |
Nonempty vector of finite, nonnegative thresholds. |
Hbi |
Nonnegative integer counts, with the same length as bi. |
Value
Invisible NULL. A plot is drawn on the current graphics device.
References
Li, H. and Pati, D. (2017). Variable selection using shrinkage priors. Computational Statistics & Data Analysis, 107, 107–119. doi:10.1016/j.csda.2016.10.008.
See Also
Examples
Beta <- rbind(c(.01, .02, .03, .3, .31, 10, 11),
              c(-.01, -.02, -.03, -.3, -.31, -10, -11))
set.seed(1)
result <- Sequential2MeansBeta(Beta, .1, .5, 2)
OptimalHbi(result$b.i, result$H.b.i)
Plot within-chain sample autocorrelations
Description
Plot within-chain sample autocorrelations
Usage
PlotAutocorrelation(draws, variable = 1L, max.lag = 40L, ...)
Arguments
draws |
Native fit or iteration by chain by variable array. |
variable |
One-based predictor index, or fitted name. |
max.lag |
Nonnegative integer maximum lag, capped at draws minus one. |
... |
Additional arguments to matplot. |
Value
Invisibly, a lag by chain autocorrelation matrix. Constant chains have NA autocorrelations, rather than evidence of mixing.
Example figure
Within-chain autocorrelations from all 3000 retained horseshoe draws per chain in the same example.

Plot posterior coefficient summaries
Description
Plot posterior coefficient summaries
Usage
PlotCoefficients(object, interval = 0.95, selected = integer(0), ...)
Arguments
object |
A native Gaussian fit. |
interval |
Equal-tail posterior interval probability. |
selected |
Optional selected predictor indices, using R's one-based convention. These change display color, not the fitted summaries. |
... |
Additional arguments to the base graphics plot. |
Value
Invisibly, the displayed summary data frame. No model is fitted.
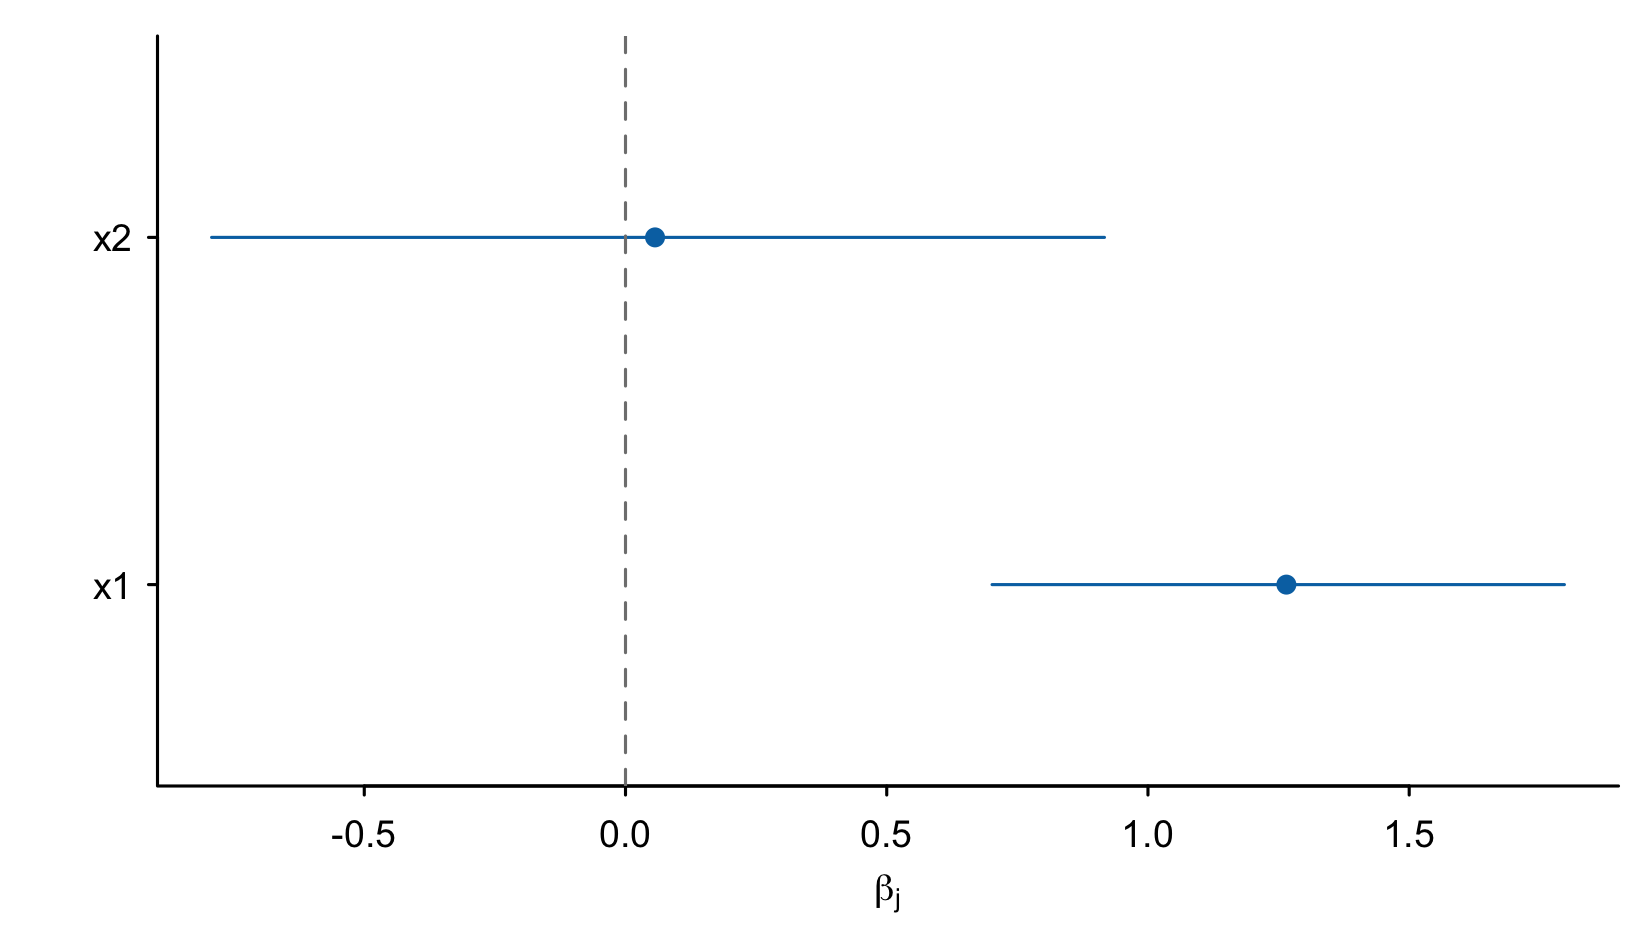
Example figure
Posterior means and 95 percent equal-tail intervals for a six-observation ridge example.
Examples
X <- matrix(c(-1,0,1,2),ncol=1)
fit <- FitRidge(X,c(-1,0,1,2),draws=30,chains=2,seed=1)
PlotCoefficients(fit)
Plot exact spike inclusion frequencies
Description
Plot exact spike inclusion frequencies
Usage
PlotInclusion(object, ...)
Arguments
object |
A result from |
... |
Additional arguments to barplot. |
Value
Invisibly, the displayed frequencies. The dashed line marks the median-probability-model cutoff; it is not an error-control threshold.
Example figure
Inclusion frequencies from four fixed coefficient rows. The dashed line marks 0.5.

Plot chains without pooling their iterations
Description
Plot chains without pooling their iterations
Usage
PlotTrace(draws, variable = 1L, ...)
Arguments
draws |
Native fit or iteration by chain by variable array. |
variable |
One-based predictor index, or a fitted predictor name. |
... |
Additional arguments to matplot. |
Value
Invisibly, the iteration by chain matrix displayed.
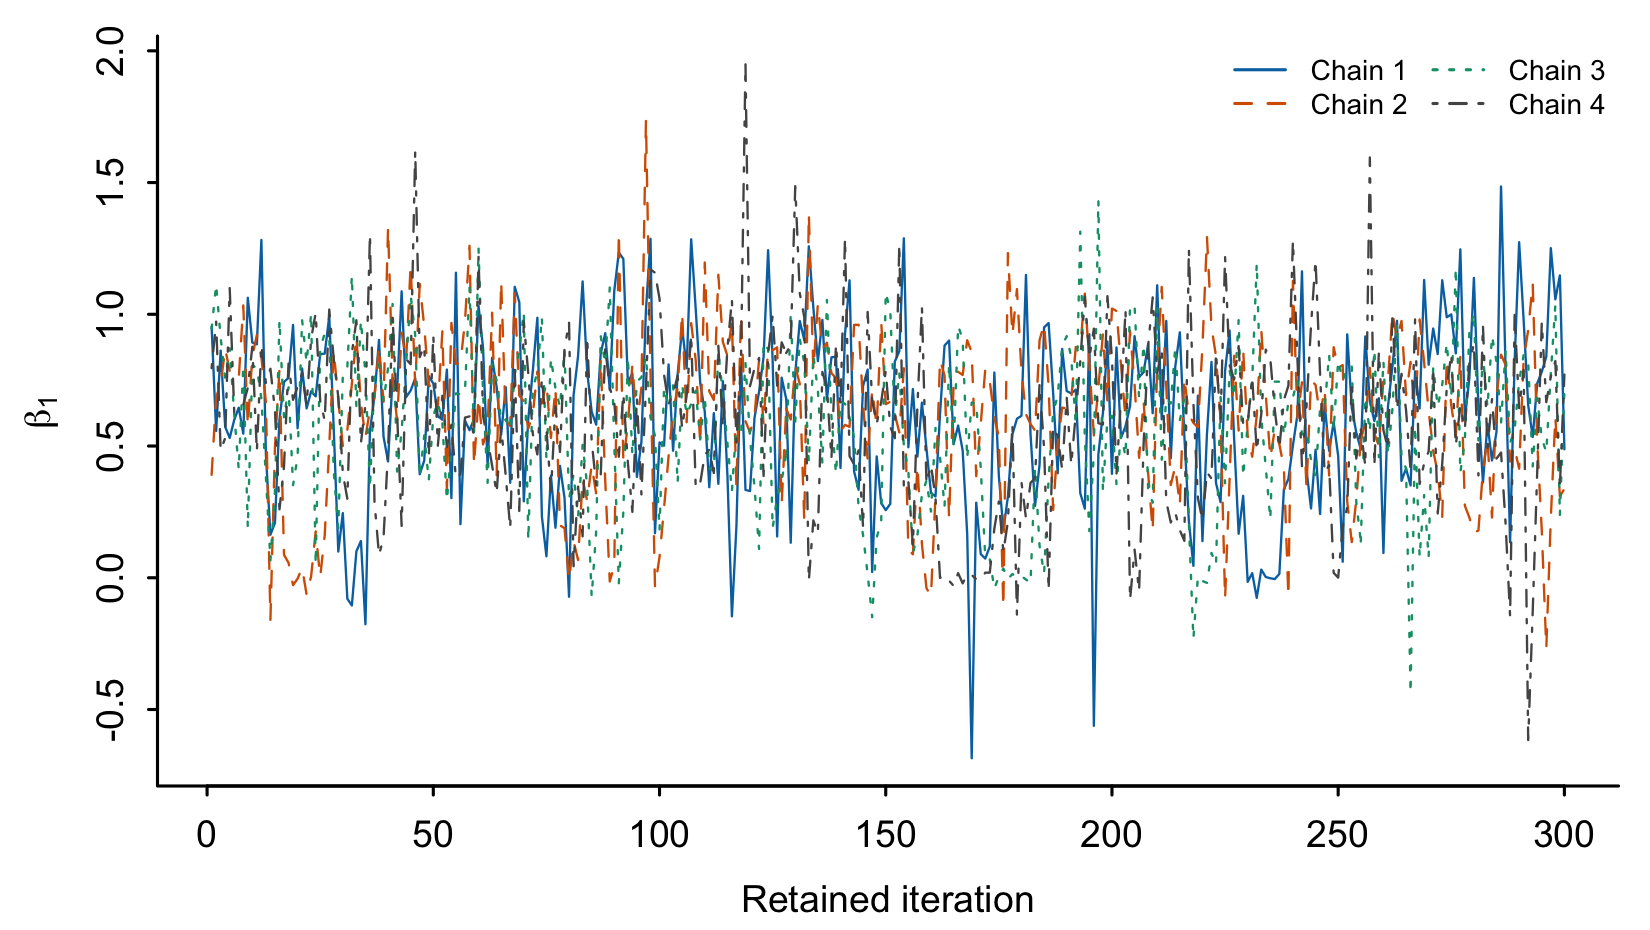
Example figure
First 300 retained draws from each of four horseshoe chains in the five-observation example. This excerpt is not a convergence assessment.
Pool retained coefficient draws for selection
Description
Pool retained coefficient draws for selection
Usage
PosteriorDraws(object)
Arguments
object |
A native Gaussian fit returned by |
Value
Numeric matrix with draws in rows and predictors in columns. Chains are combined only in this returned matrix; the fit retains its chain axes.
Examples
X <- matrix(c(-1,0,1,2), ncol=1)
fit <- FitRidge(X,c(-1,0,1,2),draws=20,chains=2,seed=3)
dim(PosteriorDraws(fit))
Summarize sensitivity to sequential two-means thresholds
Description
Compare signal counts and selected sets over an explicit threshold grid. This function does not choose a threshold.
Usage
S2MSensitivity(
  Beta,
  b.i,
  clustering = c("kmeans", "exact"),
  small.set = c("legacy", "refine")
)
Arguments
Beta |
Finite numeric matrix with posterior draws in rows and at least two coefficients in columns. Exclude any intercept column. Each draw must have at least two distinct absolute coefficients. |
b.i |
Nonempty numeric vector of finite, nonnegative thresholds, in the order to compare. Duplicate thresholds are allowed. |
clustering |
Two-means backend. "kmeans" retains the existing randomized implementation; "exact" scans all distinct adjacent cuts in one dimension. |
small.set |
Recursive stopping convention. "legacy" retains a candidate with at most two elements. "refine" splits a distinct pair and reapplies the center-gap rule, stopping at a singleton or constant candidate. |
Details
The Jaccard similarity is the intersection size divided by the union size. It describes overlap, not statistical accuracy. Count frequencies are clustering frequencies, not posterior inclusion probabilities. A stable tuning path need not recover the true variable set.
Value
A vsusp_tuning list with b.i, H.b.i and abs.post.median as in Sequential2MeansBeta, plus frequencies (a list of per-draw count tables), selected (a list of selected-index vectors), mode.proportion (the fraction of draws giving the modal count), and jaccard.previous (selected-set overlap with the preceding grid entry; NA for the first entry). The shared p field permits passing this summary to S2MVarSelectionV1.
See Also
Sequential2MeansBeta(), OptimalHbi()
Examples
Beta <- rbind(c(.01,.02,.03,.3,.31,10,11),
              c(-.01,-.02,-.03,-.3,-.31,-10,-11))
result <- S2MSensitivity(Beta,c(.1,.5),clustering="exact")
result$H.b.i
result$jaccard.previous
Select coefficients by posterior median absolute magnitude
Description
Return the indices of the H largest column medians of absolute draws.
Usage
S2MVarSelection(Beta, H = 5)
Arguments
Beta |
Finite numeric matrix with posterior draws in rows and coefficients in columns. Exclude any intercept column. |
H |
Integer number of variables to select, from zero to ncol(Beta). |
Details
H is supplied by the caller. This function does not estimate H or test statistical significance.
Value
Integer vector of selected column indices in decreasing order of median absolute magnitude. Equal medians favor larger column indices. H = 0 returns integer(0).
References
Li, H. and Pati, D. (2017). Variable selection using shrinkage priors. Computational Statistics & Data Analysis, 107, 107–119. doi:10.1016/j.csda.2016.10.008.
See Also
S2MVarSelectionV1(), Sequential2MeansBeta()
Examples
Beta <- rbind(c(.01, .02, .03, .3, .31, 10, 11),
              c(-.01, -.02, -.03, -.3, -.31, -10, -11))
set.seed(1)
result <- Sequential2MeansBeta(Beta, .1, .5, 2)
S2MVarSelection(Beta, result$H.b.i[2])
S2MVarSelection(Beta, 0)
Select coefficients from an S2M summary
Description
Select the H largest posterior median absolute coefficients from a summary returned by either S2M fitting function.
Usage
S2MVarSelectionV1(S2M, H = 5)
Arguments
S2M |
List containing p (a positive integer) and abs.post.median (a finite, nonnegative numeric vector of length p). Legacy lists with these two fields are also accepted. |
H |
Integer number of variables to select, from zero to S2M$p. |
Value
Integer vector of selected column indices, ordered by decreasing median absolute magnitude. Equal medians favor larger column indices. H = 0 returns integer(0).
References
Li, H. and Pati, D. (2017). Variable selection using shrinkage priors. Computational Statistics & Data Analysis, 107, 107–119. doi:10.1016/j.csda.2016.10.008.
See Also
S2MVarSelection(), Sequential2MeansBeta()
Examples
Beta <- rbind(c(.01, .02, .03, .3, .31, 10, 11),
              c(-.01, -.02, -.03, -.3, -.31, -10, -11))
set.seed(1)
result <- Sequential2MeansBeta(Beta, .1, .5, 2)
S2MVarSelectionV1(result, result$H.b.i[2])
Select variables with the signal adaptive variable selector
Description
Apply the closed-form signal adaptive variable selector (SAVS) of Ray and Bhattacharya to a coefficient point estimate, such as a posterior mean. The selected set can be empty.
Usage
SAVS(X, beta)
Arguments
X |
Finite numeric design matrix with observations in rows and coefficients in columns. Exclude the intercept and zero-norm columns. |
beta |
Finite numeric coefficient vector in the same column order as X. Supplied names must be unique and nonempty. If both beta and X have names, their order must agree. |
Details
A coefficient is retained when its absolute value cubed, multiplied by the squared norm of its predictor column, exceeds one. Equality gives zero. An exactly zero input coefficient gives zero without division. Direct products are used when their factors are representable. Otherwise logarithms avoid overflow; scores indistinguishable from the threshold within floating-point rounding error are set to zero.
No centering or scaling is performed. Use the same design matrix and units that define beta. SAVS depends on units: changing predictor or response scales can change the selected set. Standardize predictors before fitting if selection on a common predictor scale is wanted.
This function applies equation (2) and Algorithm 1 of the cited preprint. It does not solve the full correlated-design penalized optimization problem. It neither computes inclusion probabilities nor guarantees false-discovery control. Its behavior depends on the supplied estimate.
Value
A vsusp_sparse list with coefficients (sparse estimates), selected (integer column indices), p (number of coefficients), and log.score (log decision scores). selected is integer(0) when every coefficient is set to zero.
Selection pilot
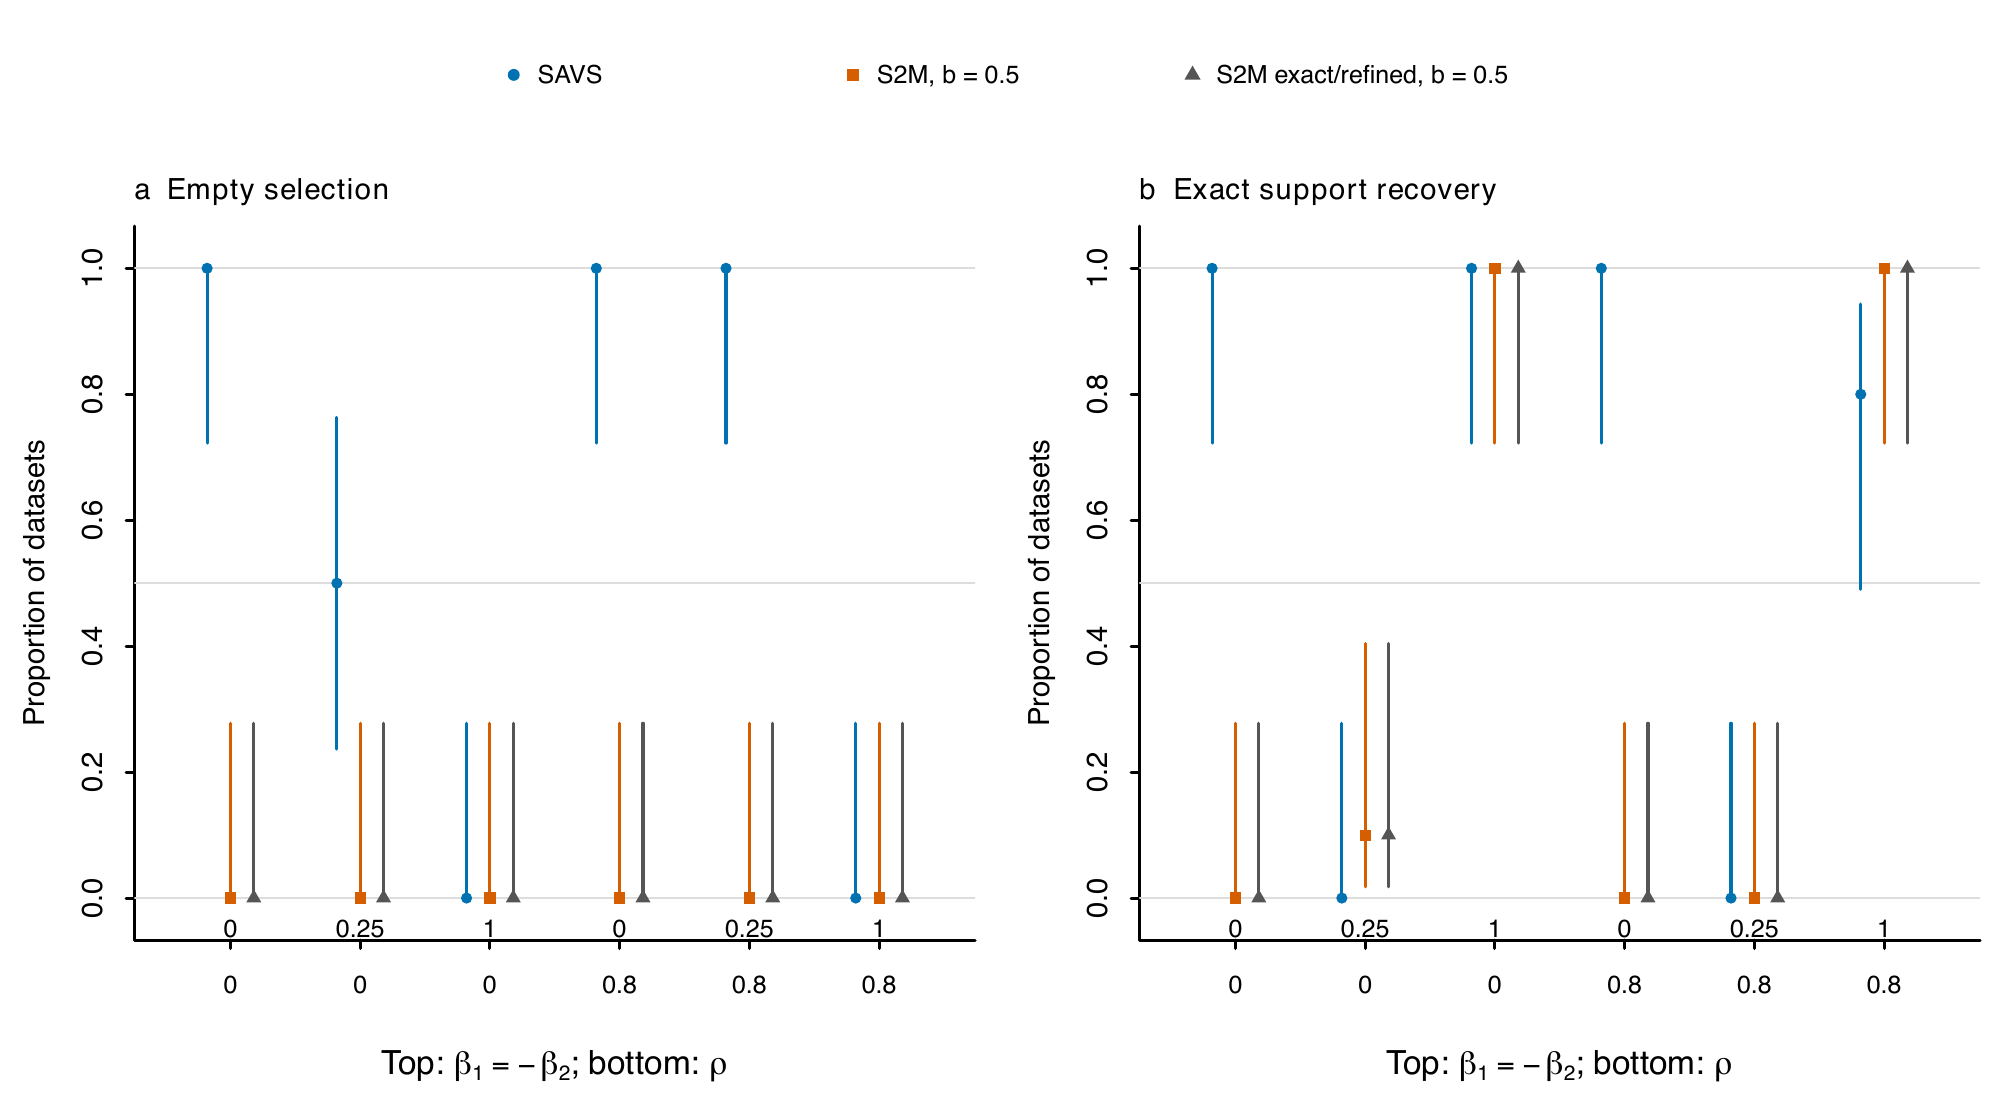
Empty-selection and exact-support proportions in six Gaussian conditions,
with ten datasets per condition and 95 percent Wilson intervals. This small
pilot does not establish false-discovery control. See the worked guide for
the design and interpretation.
References
Ray, P. and Bhattacharya, A. (2018). Signal Adaptive Variable Selector for the Horseshoe Prior. arXiv:1810.09004. https://arxiv.org/abs/1810.09004.
Examples
X <- diag(2)
SAVS(X, c(.1, -.1))$selected
SAVS(X, c(2, 0))$coefficients
Fit Gaussian shrinkage regression and apply sequential two-means
Description
Fit a Gaussian linear model with bayesreg, then apply sequential two-means (S2M) to its coefficient draws. The intercept is excluded from selection.
Usage
Sequential2Means(
  X,
  Y,
  b.i,
  prior = "horseshoe+",
  n.samples = 5000,
  burnin = 2000,
  clustering = c("kmeans", "exact"),
  small.set = c("legacy", "refine")
)
Arguments
X |
Finite numeric design matrix with observations in rows and at least two predictors in columns. |
Y |
Finite numeric response vector of length nrow(X). |
b.i |
Nonempty vector of finite, nonnegative center-gap thresholds. |
prior |
Shrinkage prior: "ridge" ("rr"), "lasso", "horseshoe" ("hs"), or "horseshoe+" ("hs+"). |
n.samples |
Integer number of requested posterior draws, at least 100. bayesreg may round this count up when using parallel workers. |
burnin |
Integer number of burn-in iterations, at least 100. |
clustering |
Two-means backend. "kmeans" retains the existing randomized implementation; "exact" scans all distinct adjacent cuts in one dimension. |
small.set |
Recursive stopping convention. "legacy" retains a candidate with at most two elements. "refine" splits a distinct pair and reapplies the center-gap rule, stopping at a singleton or constant candidate. |
Details
All returned draws are used. Thresholds are on the coefficient
scale, so predictor scaling affects their interpretation. See
Sequential2MeansBeta() for stopping conventions and limitations.
A short chain demonstrates the call; assess convergence and effective
sample size before using posterior summaries for inference.
Value
A list with Beta (returned draws in rows, predictors in columns), p (number of predictors), b.i (thresholds), H.b.i (modal signal counts), and abs.post.median (column medians of absolute coefficient draws).
References
Li, H. and Pati, D. (2017). Variable selection using shrinkage priors. Computational Statistics & Data Analysis, 107, 107–119. doi:10.1016/j.csda.2016.10.008.
Wang, H. and Song, M. (2011). Ckmeans.1d.dp: Optimal k-means clustering in one dimension by dynamic programming. The R Journal, 3(2), 29–33. doi:10.32614/RJ-2011-015.
See Also
Sequential2MeansBeta(), S2MVarSelectionV1()
Examples
set.seed(12)
X <- matrix(rnorm(120), 40, 3)
Y <- 3 * X[, 1] + rnorm(40)
result <- Sequential2Means(X, Y, c(.1, .5), prior = "ridge",
                           n.samples = 100, burnin = 100)
dim(result$Beta)
S2MVarSelectionV1(result, result$H.b.i[1])
Apply sequential two-means to posterior coefficient draws
Description
Estimate a signal count at each threshold from supplied coefficient draws, following section 2.2.1 of Li and Pati (2017).
Usage
Sequential2MeansBeta(
  Beta,
  lower,
  upper,
  l,
  clustering = c("kmeans", "exact"),
  small.set = c("legacy", "refine"),
  zero.draws = c("error", "empty")
)
Arguments
Beta |
Finite numeric matrix with posterior draws in rows and at least two coefficients in columns. Exclude any intercept column. Each draw must have at least two distinct absolute coefficients. |
lower, upper |
Finite, nonnegative threshold bounds, with lower <= upper. |
l |
Positive integer number of equally spaced thresholds. |
clustering |
Two-means backend. "kmeans" retains the existing randomized implementation; "exact" scans all distinct adjacent cuts in one dimension. |
small.set |
Recursive stopping convention. "legacy" retains a candidate with at most two elements. "refine" splits a distinct pair and reapplies the center-gap rule, stopping at a singleton or constant candidate. |
zero.draws |
Handling of entirely zero draws: |
Details
For each draw, S2M first splits absolute coefficients into two clusters. It saves the lower-mean cluster as the noise candidate set. While the center gap exceeds the threshold, it saves the current lower-mean cluster and splits that set again. At stopping it uses the saved set, rather than the lower cluster from the stopping split.
By default, the implementation retains a candidate set of at most two elements, or a candidate with identical magnitudes, without another split. For an initial pair of distinct magnitudes, the lower singleton is the noise set. An initial draw with identical magnitudes has no lower-mean cluster and is rejected. These are computational boundary conventions. The refine option can change counts when a retained pair has gap greater than b.
H.b.i is the mode of the per-draw signal counts; a frequency tie selects
the smaller count. Accepted draws always leave at least one signal, so
S2M cannot automatically select an empty model. This clustering summary
is not a posterior inclusion probability or an error-control guarantee.
Results can depend on kmeans initialization; use set.seed() for
reproducibility. The exact backend consumes no random draws. It finds the
minimum within-cluster sum of squares in floating-point arithmetic; equal
losses choose the earliest sorted cut. Numeric rescaling that collapses
distinct values is rejected. An exact clustering optimum does not establish
optimal variable selection. Scaling coefficients changes threshold meaning.
With zero.draws = "empty", all-zero draws contribute zero to the
count frequencies and their row indices are returned as zero.draws.
Other constant-magnitude draws remain invalid. This convention does not
make S2M an empty-model selector for continuous-prior draws.
Value
A list with p (number of coefficients), b.i (thresholds), H.b.i (modal signal counts), and abs.post.median (column medians of absolute coefficient draws).
References
Li, H. and Pati, D. (2017). Variable selection using shrinkage priors. Computational Statistics & Data Analysis, 107, 107–119. doi:10.1016/j.csda.2016.10.008.
Wang, H. and Song, M. (2011). Ckmeans.1d.dp: Optimal k-means clustering in one dimension by dynamic programming. The R Journal, 3(2), 29–33. doi:10.32614/RJ-2011-015.
See Also
Sequential2Means(), OptimalHbi(), S2MVarSelection()
Examples
Beta <- rbind(c(.01, .02, .03, .3, .31, 10, 11),
              c(-.01, -.02, -.03, -.3, -.31, -10, -11))
set.seed(1)
result <- Sequential2MeansBeta(Beta, .1, .5, 2)
result$H.b.i
S2MVarSelectionV1(result, result$H.b.i[2])
Summarize exact spike-and-slab posterior draws
Description
Estimate inclusion probabilities and return the median probability model (MPM) and the most frequent complete inclusion pattern visited by the draws (the empirical HPPM).
Usage
SpikeSlabSelection(Beta)
Arguments
Beta |
Finite numeric matrix with draws in rows and coefficients in columns. Exclude any intercept. Excluded coefficients must be exactly zero; all other values represent inclusion. Column names, if present, must be nonempty, nonmissing and unique. |
Details
The MPM includes variables with inclusion frequency greater than
or equal to 0.5, as in Li and Pati (2017). The empirical HPPM counts full
joint inclusion patterns, rather than combining marginal probabilities.
It estimates the highest-probability visited model from the supplied
sample; it does not establish the global posterior mode. Model rows are
ordered by first occurrence. If model frequencies tie, HPPM uses the
first observed tied model; HPPM.ties retains all tied row indices.
Exact zeros are a data contract, not a numerical tolerance. Draws from a continuous shrinkage prior are inappropriate for this summary: small nonzero values count as included. An all-zero draw is the empty model, and an entirely zero matrix returns empty MPM and HPPM selections. This function fits no model and derives no probabilities from clustering.
Value
A vsusp_spike list containing p, inclusion.probability, selected column indices
MPM and HPPM, logical matrix visited.models (one distinct model per
row), model.frequencies (model row index, draw count, proportion, and
first draw), and HPPM.ties (all model row indices tied for largest count).
References
Li, H. and Pati, D. (2017). Variable selection using shrinkage priors. Computational Statistics & Data Analysis, 107, 107–119. doi:10.1016/j.csda.2016.10.008.
Examples
Beta <- rbind(c(1, 0, 0), c(2, 0, 0), c(0, -1, 0), c(0, -2, 0))
SpikeSlabSelection(Beta)
Select variables by the paper's two-means rule
Description
Cluster each draw's absolute coefficients into two groups. The smaller group size estimates the number of signals for that draw. Select the modal number of variables using posterior medians of absolute coefficients.
Usage
TwoMeansBeta(Beta, clustering = c("exact", "kmeans"))
Arguments
Beta |
Finite numeric matrix with draws in rows and at least two coefficients in columns. Exclude any intercept. Column names, if present, must be nonempty, nonmissing and unique. |
clustering |
Either |
Details
This is the 2-M rule in Section 2.1 of Li and Pati (2017).
It uses the smaller cluster size, regardless of which cluster has the
higher mean. It is distinct from the recursive S2M noise-cluster rule.
An equal-size split has that common size. A tied modal count favors the
smaller count. Equal posterior medians favor larger column indices,
matching S2MVarSelection(). The exact backend favors the earliest cut
in sorted magnitudes when objective values tie. The kmeans backend uses
R's initialization and RNG; set a seed for reproducibility.
Two-means is undefined for constant magnitudes. As an explicit extension,
an all-zero draw has signal count zero and is not clustered. A constant
nonzero magnitude draw is rejected before consuming clustering RNG.
Neither convention is a published clustering result. H = 0 returns an
empty selection. This function summarizes supplied draws; it fits no model.
Sparse spike-and-slab draws can give zero medians for every coefficient.
Median ties may then select a coefficient never included in any draw.
Use SpikeSlabSelection() for summaries based on inclusion frequencies.
Value
A vsusp_selection list containing p, the selected count H, per-draw signal.count,
abs.post.median, selected column indices selected, a count table
frequencies, the backend clustering, and indices zero.draws of draws
handled by the zero-model boundary convention.
References
Li, H. and Pati, D. (2017). Variable selection using shrinkage priors. Computational Statistics & Data Analysis, 107, 107–119. doi:10.1016/j.csda.2016.10.008.
Examples
Beta <- rbind(c(0, .1, 10, 11, 12), c(0, -.1, -10, -11, -12))
TwoMeansBeta(Beta)
TwoMeansBeta(matrix(0, 2, 3))
Posterior coefficient means
Description
Posterior coefficient means
Usage
## S3 method for class 'vsusp_fit'
coef(object, ...)
Arguments
object |
A native Gaussian fit. |
... |
Further arguments, currently unused. |
Value
Named numeric vector of posterior coefficient means, excluding the intercept. Intercept draws remain in object$intercept.
Count coefficients in the saved S2M noise set
Description
Count coefficients in the saved S2M noise set
Usage
numNoiseCoeff(Beta.i, b.i_r, clustering = "kmeans", small.set = "legacy")
Arguments
Beta.i |
Numeric coefficient vector for one posterior draw. |
b.i_r |
Nonnegative center-gap threshold. |
clustering |
Two-means backend. "kmeans" retains the existing randomized implementation; "exact" scans all distinct adjacent cuts in one dimension. |
small.set |
Recursive stopping convention. "legacy" retains a candidate with at most two elements. "refine" splits a distinct pair and reapplies the center-gap rule, stopping at a singleton or constant candidate. |
Value
Size of the saved lower-mean candidate set.
Plot a native Gaussian fit
Description
Plot a native Gaussian fit
Usage
## S3 method for class 'vsusp_fit'
plot(x, type = c("coefficients", "trace", "acf", "inclusion"), ...)
Arguments
x |
Native Gaussian fit. |
type |
One of coefficients, trace, acf, or inclusion. |
... |
Arguments passed to the selected plotting function. |
Value
Invisibly, the displayed numerical values.
Plot a tuning path
Description
Plot a tuning path
Usage
## S3 method for class 'vsusp_tuning'
plot(x, ...)
Arguments
x |
An S2M tuning summary. |
... |
Additional graphics arguments. |
Value
Invisibly, the displayed thresholds and counts, sorted by threshold.
Example figure
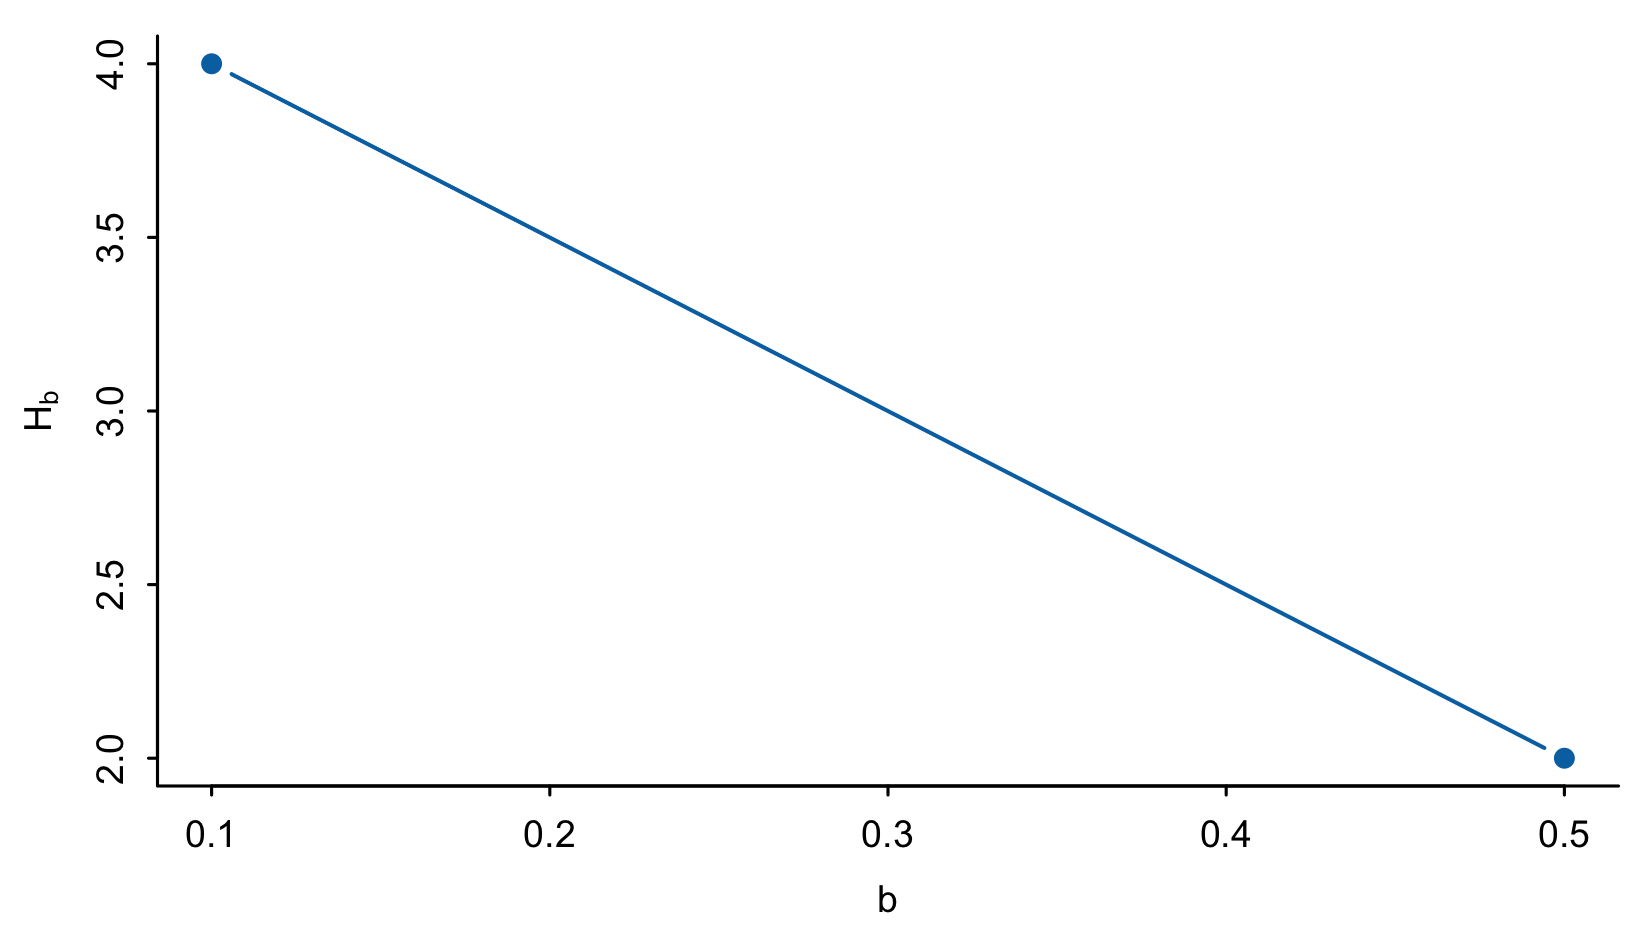
Signal counts at two thresholds for fixed seven-coefficient draws. The path does not select a threshold.
Predict from native Gaussian posterior draws
Description
Predict from native Gaussian posterior draws
Usage
## S3 method for class 'vsusp_fit'
predict(
  object,
  newdata,
  interval = 0.95,
  include.noise = FALSE,
  seed = NULL,
  ...
)
Arguments
object |
A native Gaussian fit. |
newdata |
Numeric predictor matrix in the fitted column order. If column names are supplied, they must match the fitted names and order. |
interval |
Posterior interval probability. |
include.noise |
Logical: include independent observation noise in the interval draws. The reported mean remains the posterior conditional mean. |
seed |
Optional nonnegative prediction seed; preserves the caller RNG. |
... |
Further arguments, currently unused. |
Value
List with mean, lower, upper, interval and kind. Intervals are pointwise posterior intervals, not simultaneous bands. kind is "mean" or "observation". Prediction does not refit the model.
Predict using sparse coefficient summaries
Description
Predict using sparse coefficient summaries
Usage
## S3 method for class 'vsusp_sparse'
predict(object, newdata, intercept = 0, ...)
Arguments
object |
|
newdata |
Numeric matrix in the coefficient order. |
intercept |
Finite intercept added to the sparse linear prediction. |
... |
Further arguments, currently unused. |
Value
Numeric vector. This method returns sparse linear predictions; it supplies no uncertainty interval and does not refit a model.
Summarize native Gaussian posterior draws
Description
Summarize native Gaussian posterior draws
Usage
## S3 method for class 'vsusp_fit'
summary(object, interval = 0.95, ...)
Arguments
object |
A native Gaussian fit. |
interval |
Posterior interval probability, strictly between zero and one. |
... |
Further arguments, currently unused. |
Value
Data frame with posterior mean, SD, lower and upper equal-tail limits. SD is NA when only one draw is available.
Summarize basic two-means selection
Description
Summarize basic two-means selection
Usage
## S3 method for class 'vsusp_selection'
summary(object, ...)
Arguments
object |
A result from |
... |
Further arguments, currently unused. |
Value
Named selected indices, preserving the fitted ranking.
Summarize sparse coefficient results
Description
Summarize sparse coefficient results
Usage
## S3 method for class 'vsusp_sparse'
summary(object, ...)
Arguments
object |
|
... |
Further arguments, currently unused. |
Value
Data frame with coefficient values and a selected indicator.
Summarize exact spike-and-slab inclusion draws
Description
Summarize exact spike-and-slab inclusion draws
Usage
## S3 method for class 'vsusp_spike'
summary(object, ...)
Arguments
object |
A result from |
... |
Further arguments, currently unused. |
Value
Data frame of inclusion frequencies and median-probability-model membership. Clustering frequencies are not accepted as inclusion draws.
Summarize an S2M tuning path
Description
Summarize an S2M tuning path
Usage
## S3 method for class 'vsusp_tuning'
summary(object, ...)
Arguments
object |
An S2M sensitivity or coefficient-draw summary. |
... |
Further arguments, currently unused. |
Value
Data frame of thresholds and modal signal counts, with modal frequencies when those were retained. This does not choose a threshold.