nerfplus is an R package for fitting and interpreting Network-assisted Random Forest+ (NeRF+) models, as introduced in Tang, Levina, and Zhu (2025). At a high-level, NeRF+ provides a flexible and interpretable framework to incorporate network information alongside node-level covariate information in a generalized random forest framework. In practice, NeRF+ often exhibits highly-competitive predictive performance and importantly, can also be easily interpreted using feature importance and sample influence measures that are implemented in this package’s interpretability toolkit.
You can install the development version of nerfplus from GitHub with:
# install.packages("remotes")
remotes::install_github("tiffanymtang/nerfplus", subdir = "nerfplus")
# or uncomment below to install with suggested dependencies; necessary to launch Shiny App
# remotes::install_github("tiffanymtang/nerfplus", subdir = "nerfplus", dependencies = "Suggests")To demonstrate how to use nerfplus, we will make use of an example dataset provided in the package:
library(nerfplus)
set.seed(331)

# load example data
data(example_data)
str(example_data)
#> List of 6
#>  $ x     : num [1:80, 1:10] -0.0676 -1.0671 0.4536 1.479 0.0363 ...
#>  $ xtest : num [1:40, 1:10] -1.4549 -0.1724 -0.6287 0.0805 -0.3741 ...
#>  $ y     : num [1:80] -0.842 -2.413 -0.131 0.313 -0.714 ...
#>  $ ytest : num [1:40] -2.24 -1.36 -1.55 -1.21 -1.41 ...
#>  $ A     : num [1:80, 1:80] 0 1 1 1 0 1 0 1 1 1 ...
#>  $ A_full: num [1:120, 1:120] 0 1 1 1 0 1 0 1 1 1 ...
This example data contains:
x: training covariate dataxtest: test covariate datay: training response dataytest: test response dataA: training adjacency matrixA_full: full adjacency matrix (training and test
samples combined)Note that the samples in A_full must be aligned with the
rows of x and xtest, in that order. If not,
you can provide a vector of node IDs to indicate the alignment
(nodeids for the training samples and
nodeids_test for the test samples’ see
? nerfplus::interpret_nerfplus for details).
Using this example dataset, we can first fit NeRF+ with pre-specified hyperparameters via:
lambda_netcoh <- 1
lambda_embed <- 0.1
lambda_raw <- 2
lambda_stump <- 3
fit <- nerfplus(
  x = example_data$x, y = example_data$y, A = example_data$A,
  lambda_netcoh = lambda_netcoh,
  lambda_embed = lambda_embed,
  lambda_raw = lambda_raw,
  lambda_stump = lambda_stump,
  family = "linear", embedding = "laplacian"
)
If we want to tune the hyperparameters, we can instead use
nerfplus_cv().
lambdas_netcoh <- exp(seq(log(100), log(0.01), length.out = 5))
lambdas_embed <- exp(seq(log(100), log(0.01), length.out = 5))
lambdas_raw <- exp(seq(log(100), log(0.01), length.out = 5))
lambdas_stump <- exp(seq(log(100), log(0.01), length.out = 5))
cv_fit <- nerfplus_cv(
  x = example_data$x, y = example_data$y, A = example_data$A,
  lambdas_netcoh = lambdas_netcoh,
  lambdas_embed = lambdas_embed,
  lambdas_raw = lambdas_raw,
  lambdas_stump = lambdas_stump,
  family = "linear", embedding = "laplacian"
)
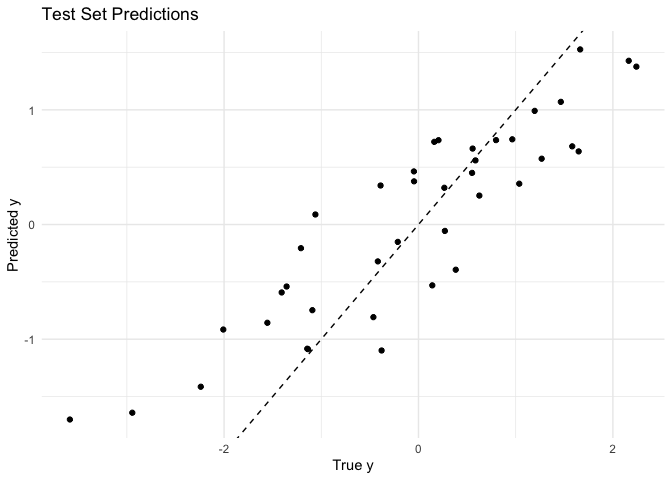
Let’s quickly make predictions on the test set using our fitted (tuned) model and check its test prediction performance.
yhat <- predict(
  cv_fit, x = example_data$xtest, A_full = example_data$A_full
)
cat(sprintf("Test MSE: %.3f", mean((yhat - example_data$ytest)^2)))
#> Test MSE: 0.482data.frame(ytest = example_data$ytest, yhat = yhat) |>
ggplot2::ggplot(ggplot2::aes(x = ytest, y = yhat)) +
ggplot2::geom_point() +
ggplot2::geom_abline(
slope = 1, intercept = 0, color = "black", linetype = "dashed"
) +
ggplot2::labs(
title = "Test Set Predictions",
x = "True y",
y = "Predicted y"
) +
ggplot2::theme_minimal()
To next interpret our fitted NeRF+ model, we can report:
interpret_results <- interpret_nerfplus(
  cv_fit,
  x = example_data$x, y = example_data$y, A = example_data$A,
  xtest = example_data$xtest, ytest = example_data$ytest,
  A_full = example_data$A_full,
  methods = c("permute", "mdi+", "local", "loo"),
  # save = TRUE,
  B = 25  # B = number of permutations
)
Or if we want to compute each of these interpretability measures separately, we can do so via:
# permutation global feature importance
perm_globalfi <- get_feature_importances(
  cv_fit,
  x = example_data$xtest, y = example_data$ytest, A_full = example_data$A_full,
  method = "permute", B = 25  # B = number of permutations
)

# MDI+ global feature importance
mdiplus_globalfi <- get_feature_importances(
  cv_fit,
  x = example_data$xtest, y = example_data$ytest, A_full = example_data$A_full,
  method = "mdi+"
)

# local feature importance
localfi <- get_feature_importances(
  cv_fit,
  x = example_data$xtest, y = example_data$ytest, A_full = example_data$A_full,
  method = "local"
)

# leave-one-out sample influence
loo_out <- get_loo(
  cv_fit,
  x = example_data$x, y = example_data$y, A = example_data$A,
  xtest = example_data$xtest, ytest = example_data$ytest,
  A_full = example_data$A_full
)To further ease the interpretation of NeRF+ models, we also created a Shiny App that allows users to visualize and explore the feature importance and sample influence results interactively.

There are two main ways to launch the app. Note that both options
rely on the suggested dependencies being installed. If you did not
install the package with suggested dependencies, you can do so by
running
remotes::install_github("tiffanymtang/nerfplus", subdir = "nerfplus", dependencies = "Suggests").
Option 1: Launch the app directly from R without any arguments.
The Shiny App can be launched directly from R via the
run_app() function:
run_app()After launching the app, users can upload their own data and their fitted NeRF+ model (or pre-computed interpretability results) in the app to then explore the results.
Note: If users want to upload their pre-computed
interpretability results (as opposed to having the Shiny App compute
them), they can do so by uploading the .rds files created
by the interpret_nerfplus(save = TRUE) function.
Option 2: Launch the app directly from R with pre-computed interpretability results.
Alternatively, users can use the interpret_nerfplus()
function to compute the interpretability results first, and then launch
the Shiny App with these results as arguments to run_app().
For example:
interpret_results <- interpret_nerfplus(
  cv_fit,
  x = example_data$x, y = example_data$y, A = example_data$A,
  xtest = example_data$xtest, ytest = example_data$ytest,
  A_full = example_data$A_full,
  methods = c("permute", "mdi+", "local", "loo"), B = 25
)
run_app(
  data_list = interpret_results$data_list,
  object = interpret_results$object,
  fi_results = interpret_results$fi_results,
  loo_results = interpret_results$loo_results
)@article{tang2025interpretable,
title={Interpretable Network-assisted Random Forest+},
author={Tiffany M. Tang and Elizaveta Levina and Ji Zhu},
year={2025},
eprint={2509.15611},
archivePrefix={arXiv},
primaryClass={stat.ML},
url={https://arxiv.org/abs/2509.15611},
}